
At the root of successful system diagnosis is a rigorous adherence to scientific reasoning. There exists no single algorithmic approach to solving problems, but rather a singular mind-set characterized by the following traits:
- Curiosity
- Persistence
- Attention to detail
- Diligence in checking conclusions
- Regular checking of assumptions
- A willingness to abandon ideas based on contrary evidence
Science is, at its heart, a methodology useful to identify causes and effects. Thus, it is well-suited to the problem of system diagnosis, where our goal is to quickly and accurately identify the cause(s) behind improper operation (effects).
34.6.1 Scientific method
Although no one technique seems to be universally recognized as “the scientific method,” the following steps are commonly applied in science to determine causes and effects:
- Observe effects, and then create hypotheses (explanations accounting for those observations)
- Design a test for one or more of those hypotheses
- Perform the test (experiment), and collect data from it
- Validate or invalidate the hypotheses based on the data
- Repeat
Perhaps the most challenging step in this method is designing a good test for the hypotheses. By “test” I mean a trial that really challenges each hypothesis, and doesn’t just collect more data to support it. A good way to help yourself devise a rigorous test of any hypothesis is to keep these two questions in mind:
“If this hypothesis is true, what other effects should we see if we look for them?”. . . and . . .
“If this hypothesis is false, what other effects should we not see if we look for them?”
An ideal test (experiment) is one that answers both of these questions at once, providing both positive and negative evidence.
In contrast to scientific diagnosis is a technique a colleague of mine refers to as “Easter-egging,” where the troubleshooter tries to find the problem by individually checking every component or possible fault they can think of, in serial fashion. The term “Easter-egging” invokes the image of children hunting for hidden eggs on Easter morning, randomly searching in every place they can think of where an egg might be hidden. There is no logical reasoning to “Easter-egging” and so it is a very inefficient method of solving system problems.
34.6.2 Occam’s Razor
A very helpful principle in scientific testing is something called Occam’s Razor, a rule stating that the simplest explanation for any observed effects is usually the most accurate. While not infallible, Occam’s Razor is nevertheless a valid “gambling strategy” based on simple probability. In system troubleshooting, it means that a single fault is more likely to account for the symptoms than a set of coincidental faults. For this reason, it is generally good practice to enter a troubleshooting scenario with the assumption that only one thing is wrong, unless the data conclusively points otherwise.
34.6.3 Diagnosing intermittent problems
Intermittent faults are some of the most challenging to diagnose, for the simple reason that the relevant symptoms come and go. A persistent fault is easier to solve because the data is continuously there for inspection.
The key to troubleshooting intermittent faults is to set up test equipment to capture events that occur when you are not directly observing them. Some suggested methods include:
- Using the “Min/Max” capture mode on a digital multimeter (DMM)
- Using a data recorder or event logger to capture signal history
- Looking for evidence left by certain intermittent faults (e.g. if the suspected fault is high temperature at a certain location, looking for evidence such as charring or discoloration that would be caused by high temperature at some past time)
- Using videorecording equipment to capture events
Perhaps one of the most useful features of modern digital multimeters is the ability to capture minimum and maximum signal levels. Many times I have used this feature on my own meter to monitor the highs and lows of some signal in order to capture evidence of an intermittent fault. This is also useful for monitoring signal changes that happen too fast to see on the display of a meter (e.g. detecting the peak pulse amplitude of a fast signal). While limited to the sample rate of the digital meter, it remains a powerful tool in the hands of a knowledgeable technician.
A colleague of mine once diagnosed a complex, intermittent problem on a natural gas compressor unit by setting up a video camera to film the control panel gauges on the compressor, then reviewing the video recording frame-by-frame after the camera had recorded a “trip” event. This kind of creativity is often key to diagnosing intermittent problems.
34.6.4 Strategy: tracing data paths
A method often useful for tracing the location of faults in complex systems is to identify where data is coming from (source), where it is going (destination), and all paths taken by the data in between. If we then plot those paths on a one-line diagram of the system, the intersection of paths often tells us where the problem lies.
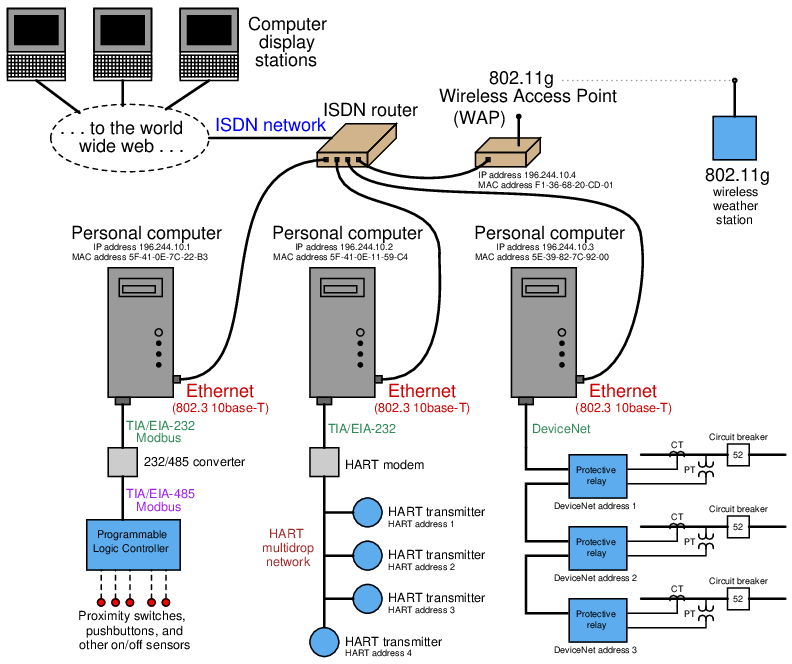
For example, consider this system of networked devices in a data acquisition system:
Suppose operations personnel noticed they could no longer access any protective relay data from the left-most display station connected to the world-wide web (Internet), but they could still access live weather station data from that same display station. Applying the technique of tracing data paths may be helpful to us in locating the fault in this complex system, and also devising a good test to pinpoint the location.
Here we see the same system with green and red lines overlaid showing good data paths and failed data paths:
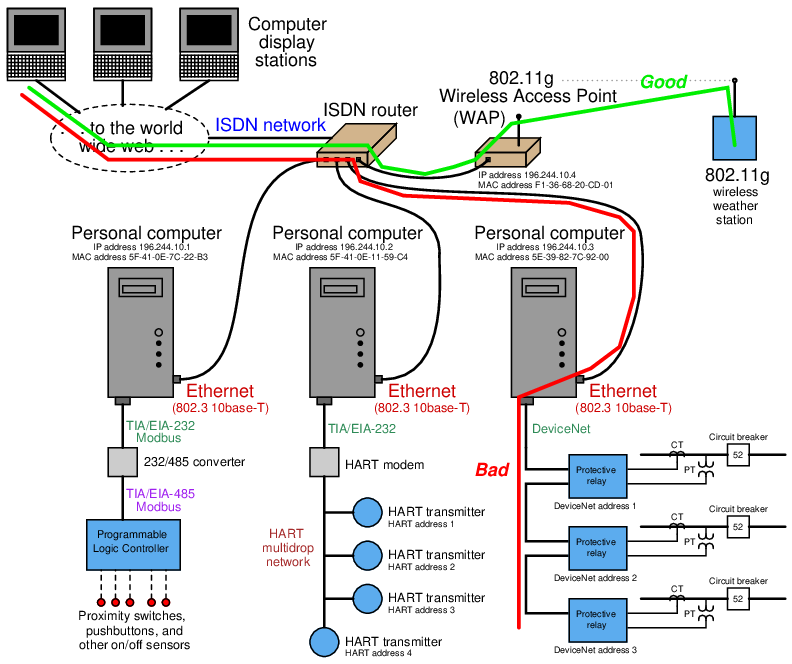
Note how these two paths overlap in the display station, the world-wide-web, and the ISDN router. Since data from the weather station is getting through this part of the path just fine, yet protective relay data is not, the most likely location of the fault is in a part of the system where these two data paths are not common. In other words, it is unlikely that the problem lies within the display station, the Internet, or the ISDN router, because all those component are proven to work just fine for the weather station data. A more probable location of the fault is in an area of the “bad” data path that is not common to the “good” data path. In this particular case, it points to a problem from the ISDN router to the DeviceNet network.
A good test to do at this point is to try “pinging” the right-most personal computer from one of the other two personal computers connected directly to the ISDN router. This would be testing a data path from one PC to the other, thereby testing the integrity of the right-most PC and the cable connecting it to the ISDN router. If this test is successful, the problem likely lies farther beyond the PC (e.g. in the DeviceNet network) ; if this test is unsuccessful, the problem likely lies within that PC or within the cabling connecting it to the router.
Note the careful use of the words “likely” and “probable” in the hypotheses. Hypotheses are uncertain by their very nature, and are never “proven” in any final sense. Even though our initial approach of sketching and comparing data pathways suggests a problem between the ISDN router and the DeviceNet network connecting the protective relays together, it is still possible for the problem to lie somewhere closer to the display station. If, for example, the display station relied on dedicated software “drivers” to properly poll and interpret data from the protective relay network that were not used to do the same for weather station data, the problem could actually lie within the display station! A corrupted relay driver would prevent that station from properly displaying protective relay data and yet permit the display of weather station data. In order for our data path tracing procedure to encompass this possibility, we would need to show the pathways splitting within the display station, so they would no longer be common to each other:
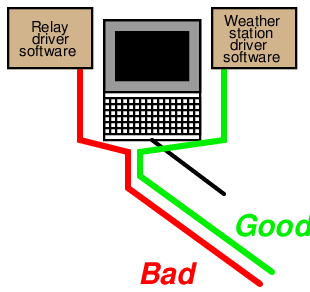
As always, the assumptions we embed into our hypotheses can skew their validity. If we assume completely overlapping data paths for protective relay and weather data within the display station, we would not recognize the possibility of a driver problem.