
Much of our knowledge about atomic structure comes from experimental data relating the interaction between light and atoms of the different elements. Light may be modeled as an electromagnetic wave, consisting of an oscillating electric field and an oscillating magnetic field. Like any wave, the relationship between propagation velocity, wavelength, and frequency is described by the following equation:

Where,
v = Velocity of propagation (e.g. meters per second)
λ = Wavelength (e.g. meters)
f = Frequency of wave (e.g. Hz, or 1/seconds)
When applied to light waves, this equation is typically written as c = λf, where c is the speed of light in a vacuum (≈ 3 × 10⁸ meters per second): one of the fundamental constants of physics.
Light that is visible to the human eye has wavelengths approximately between 400 nm (400 nanometers) at the violet end of the spectrum and 700 nm at the red end of the spectrum. Given the speed of light, this equates to a frequency range for visible light between 7.5 × 10¹⁴ Hz and 4.286 × 10¹⁴ Hz.
A computer-generated image of the visible light spectrum (plus the ultraviolet and infrared regions outside of the visible range, shown in grey) appears here. A real spectrum may be generated by taking “white” light and passing it through either a prism or a diffraction grating so that the different wavelengths separate from each other:

Just as buoyant objects are moved up and down by waves of water, electrically-charged objects may be moved about by waves of electrical fields such as light. In the case of electrons, their positions around the nucleus of an atom may be altered if struck by light of the necessary wavelength.
One of the major breakthrough discoveries of modern physics was the realization that a ray of light could be modeled as a stream of particles – each of these “photon” particles possessing a definite amount of energy – in addition to being modeled as a continuous wave possessing a definite frequency. The combined work of physicists Max Planck in 1900 and Albert Einstein in 1905 resulted in the following equation relating a photon’s energy to its frequency:

Where,
E = Energy carried by a single “photon” of light (joules)
h = Planck’s constant (6.626 × 10⁻³⁴ joule-seconds)
f = Frequency of light wave (Hz, or 1/seconds)
We may re-write this equation to express a photon’s energy in terms of its wavelength (λ) rather than its frequency (f), knowing the equation relating those two variables for waves of light (c = λf):

Physicists knew that light carried energy, but now they understood that the energy carried by a beam of light was finely divided into fixed (“quantized”) amounts corresponding to the wavelength of each particle-wave (photon). That is to say, a beam of monochromatic (single-color, or single-wavelength) light consists of photons having exactly the same energies, and total beam power is simply a matter of how many of those photons per second pass by. Varying the intensity of a monochromatic light beam without changing its wavelength (color) only changes the number of photons per second, not the amount of energy carried by each photon.
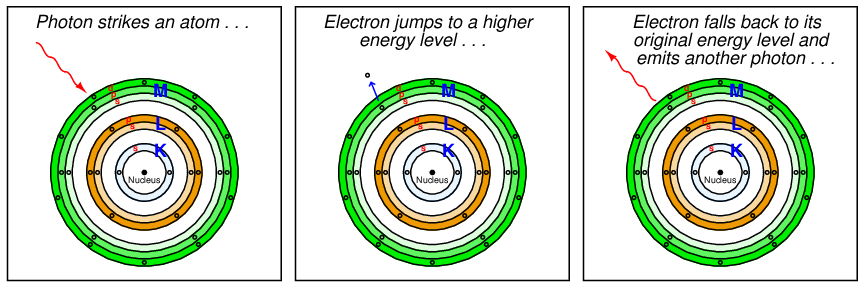
If the amount of energy carried by a photon happens to match the energy required to make an atomic electron “jump” from one energy level to another within the atom, the photon will be consumed in the work of that task when it strikes the atom. Conversely, when that “excited” electron returns to its original (lower) energy level in the atom, it releases a photon of the same frequency as the original photon that excited the electron:
Since the energy levels available for an electron to “jump” within an atom are limited to certain fixed values by virtue of the atom’s shell and subshell structure, this means only certain specific frequencies or wavelengths of light will be able to make an electron of a particular atom move to new shells and/or subshells18 . A startling consequence of this quantum theory of light was that the ability of a light beam to dislodge electrons from an atom depended on the color (wavelength or frequency) of the photons, and not the intensity (total power) of the light beam. A light beam consisting of photons with insufficient individual energy (i.e. frequency too low; wavelength too long; color too far shifted toward red if visible) is incapable of boosting electrons from a lower energy level to a higher energy level, no matter how intense that beam may be. This is analogous to shooting an armored target with slow-moving bullets: so long as the velocity (kinetic energy) of each bullet is insufficient to penetrate the armor, it does not matter how many of those low-energy bullets are fired at the target, or how frequently they are fired. However, just a single bullet with sufficient kinetic energy will be sufficient to penetrate the armor.
The discovery of photons having discrete energy values was a major shift in scientific thought, setting physics down a new path of understanding matter and energy in quantum terms. It was this new quantum theory of matter and energy that led to the modern understanding of atomic electron structure, with all its shells, subshells, and orbitals. Later mathematical contributions to quantum theory from physicists such as Louis de Broglie, Werner Heisenberg, and especially Erwin Schrödinger provided tools to calculate the probability distributions of electrons within atoms. The oddly-shaped orbital electron “clouds” discussed earlier in this chapter are in fact solutions to Schrödinger’s wave equation for electrons at different energy levels:

This is why the notation used in the previous section to describe electron configurations (e.g. 1s22s22p1) is called spectroscopic notation: the discovery of shells, subshells, and orbitals owes itself to the analysis of light wavelengths associated with different types of atoms, studied with a device called a spectroscope constructed to analyze the wavelengths of light across the visible spectrum. Just as the telescope was the first tool scientists used to explore outer space, the spectroscope was one of the first tools used by scientists to explore the “inner space” of atomic structure.
3.5.1 Emission spectroscopy
If we take a sample of atoms, all of the same element and at a low density19 (e.g. a gas or vapor), and “excite” them with a source of energy such as an electric arc, we will notice those atoms emit colors of light that are characteristically unique to that element:
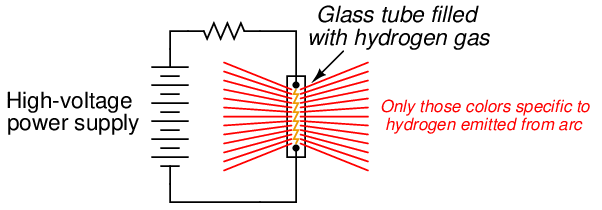
This phenomenon is used to make colored discharge (“neon”) lights. While neon gas glows with a characteristic pink-orange color, other gases glow with their own signature colors. By filling glass tubes with the right gas(es), a wide variety of colors may be produced.
These colors are unique to their respective gases because the unique electron configurations of each element creates a unique set of energy values between which atomic electrons of that element may “jump.” Since no two elements have the exact same electron configurations, no two elements will have the exact same set of available energy levels for their electrons to occupy. When excited electrons fall back into lower shell levels, the photons they emit will have distinct wavelengths. The result is an emission spectrum of light wavelengths, much like a “fingerprint” unique to that element. Indeed, just as fingerprints may be used to identify a person, the spectrum of light emitted by an “excited” sample of an element may be used to identify that element.
For example, we see here the emission spectrum for hydrogen, shown immediately below the continuous spectrum of visible light for convenient reference20 :

Each of the colored “lines” in the emission spectrum for hydrogen represents the photon wavelength emitted when the excited electron loses energy and falls back into a lower-level position. The larger the energy difference between energy levels (i.e. the bigger the jump), the more energy the photon carries away, and consequently the shorter the wavelength (higher the frequency) of the photon. The violet color line, therefore, represents one of the larger “jumps” while the red color line represents one of the smaller. Hydrogen happens to emit four different wavelengths within the visible range (656 nm, 486 nm, 434 nm, and 410 nm), and many others outside the visible range.
This next illustration shows a simplified view of a hydrogen atom, with the lowest-level shell (n = 1, K) representing the ground state and higher-level shells representing “excited” energy states for its single electron:
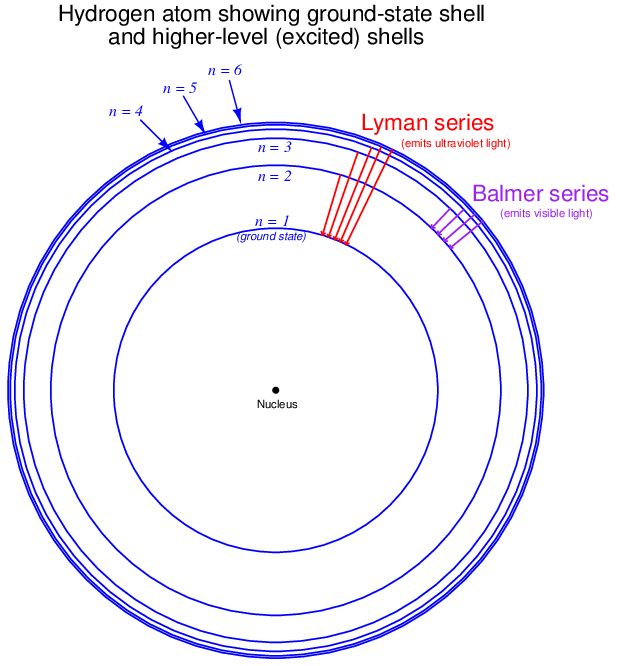
Wavelengths of light emitted when an excited electron falls from any high-level shell down to the second shell of hydrogen (n = 2 ; L) are called the Balmer series of spectral lines. The four wavelengths previously mentioned are Balmer lines visible to the human eye: 410 nm resulting from an electron jumping from the sixth shell (n = 6 ; P) to the second shell, 434 nm resulting from a transition between the fifth and second shells, 486 nm from a transition between the fourth and second shells, and finally the 656 nm wavelength resulting from a transition between the third and second shells. Other Balmer-series wavelengths exist21 (electrons transitioning from even higher shells than the sixth, down to the second), but these wavelengths lie within the ultraviolet range and are therefore not visible to the human eye. Note the inverse relationship between jump distance and wavelength: the shortest “jump” (shell 3 to shell 2) yields the photon with the longest wavelength (656 nm). This is because the shortest jump represents the smallest energy change, which then results in a photon of comparatively little energy, having a low frequency and therefore a long wavelength.
You will note that the Balmer series of wavelengths do not involve an electron falling all the way back to the hydrogen atom’s “ground state” (the normal, or un-excited state of shell n = 1, the “K” shell). Electrons falling down to the first shell (n = 1; K) from any higher-level shells will also emit photons, but these photons will be of a far shorter wavelength (higher frequency, higher energy) than any in the Balmer series, owing to the larger energy gap between the first shell and all the others. This so-called Lyman series of light wavelengths lies within the region of wavelengths referred to as “far-ultraviolet,” well outside the range of human vision.
This next graphic shows the emission spectra of several elements contrasted against a continuous spectrum covering both visible light and portions of the ultraviolet and infrared ranges:
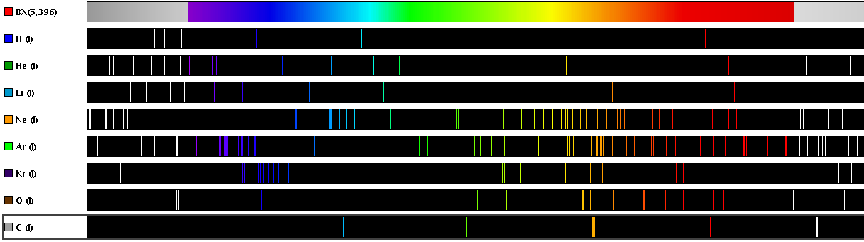
Note how complex the emission spectra are for some of the elements. Since we know each spectral line represents a unique change in energy (i.e. a unique “jump distance” from one energy level to another), the multitude of lines we see for each element shows us the range of “jumps” possible within certain atoms. Note also how spectral lines for most elements (including hydrogen) extend past the visible light range. Lines in the ultraviolet range comes from large electron transitions, as electrons fall from high-level shells to low-level shells and lose much energy. Lines in the infrared range originate from small electron transitions, as electrons transition between adjacent shells and lose little energy.
Not only may the wavelengths of photons emitted from “excited” electrons returning to lower-energy conditions be used to positively identify different elements, but we may also use those wavelengths as universal standards, since the fundamental properties of elements are not liable to change. For example, the SI (Système International) definition for the base unit of the meter is standardized as 1650763.73 wavelengths of light emitted by a krypton-86 (86Kr) atom as its electrons transition between the 2p10 and 5d5 subshells22 .
3.5.2 Absorption spectroscopy
If we take a sample of atoms, all of the same element and at a low density (e.g. a gas or vapor), and pass a continuous (“white”) spectrum of light wavelengths through that sample, we will notice certain colors of light missing from the light exiting the sample:
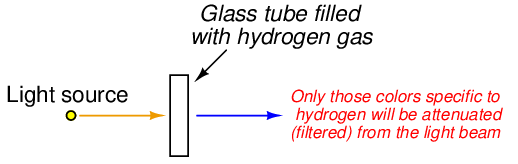
Not only are these missing wavelengths characteristically unique to that element, but they are the exact same wavelengths of light found in the emission spectrum for that element! The same photon wavelengths produced by an atom when “excited” by an external energy source will be readily absorbed by that atom if exposed to them. Thus, the spectrum of light missing characteristic wavelengths after passing through a gas sample is called an absorption spectrum, and may be used to identify elements just as easily23 as an emission spectrum.
The absorption spectrum of hydrogen gas is shown at the bottom of this three-spectrum graphic image, contrasted against the continuous spectrum of visible light (top) and the emission spectrum for hydrogen (middle):

Note how the four colored lines in the emission spectrum characteristic of hydrogen appear as missing colors (black lines) in the absorption spectrum. It is almost as though one hydrogen spectrum were a photographic “negative” of the other: each of the colors present in the emission spectrum is distinctly absent24 in the absorption spectrum. Although the color patterns may be inverted, the positions of the lines within the spectrum are the same, and are uniquely representative of hydrogen.
The effect is analogous to fingerprints made two different ways: one by pressing a pre-inked finger onto a clean sheet of paper; the other by pressing a clean finger onto pre-inked paper. In the first method, the result is a set of dark ink-marks where the fingerprint ridges touched the paper to apply ink and light areas where skin and paper never touched. In the second method, the result is a set of inverse ink-marks: light where the fingerprint ridges touched the paper to remove ink and dark where skin and paper never touched. The fingerprint patterns in both cases – if made using the same finger – will be identical in form, just inverted in color. Likewise, the patterns of emission and absorption spectroscopy will be the same for any given substance, just inverted in color: emission spectroscopy shows select wavelengths against an otherwise dark field, while absorption spectroscopy shows a nearly-full spectrum of color missing (the same) select wavelengths.
Individual atoms are not the only forms of matter possessing uniquely identifying spectra – many molecules have spectral “signatures” of their own as well. The absorption spectra for molecular substances are substantially more complex than the absorption spectra of pure elements, owing to the many more different ways in which light energy may be absorbed by a molecule. In addition to electron shell and subshell “jumps” capable of absorbing a photon’s energy, the atoms within a molecule are also able to vibrate, rotate, and twist about each other like mechanical oscillators. Photons of light possessing just the right frequencies are able to “excite” certain molecules in a manner not unlike AC electrical waveforms resonating with tuned LC (inductor-capacitor) circuits. Just as tuned LC circuits absorb and store energy at certain frequencies, molecular oscillators absorb and store energy from photons.
The multiplicity of energy-absorbing modes for certain molecules gives them wide bands of absorption in the light spectrum, not just thin “lines” as is the case with individual atoms. These bands are still unique to each molecule type, but they typically cover a far broader swath of wavelengths than is typical for atomic absorption spectra.
The absorption of ultraviolet light by ozone gas (O3) high in Earth’s atmosphere is an example of absorption spectroscopy on a grand scale. These molecules serve as a protective “blanket” against ultraviolet light rays from the sun which have detrimental effects on life (e.g. sunburn, skin cancer). The ozone does not absorb light in the visible spectrum, and so its protective effects are not visually apparent, but the attenuation of ultraviolet light is definitely measurable. This attenuation also covers far more than just one or two specific wavelengths of ultraviolet light, which is good for life on Earth because otherwise ozone wouldn’t offer much protection.
Many chemical substances of interest in process industries have well-known absorption signatures for ultraviolet and infrared light. This makes spectroscopy a powerful tool for the identification (and quantitative measurement) of chemical composition in process fluids, exhaust gases, and sometimes even in solid materials.
An interesting application of optical absorption is the detection of gas leaks using an infrared camera. Many industrial gases are strong absorbers of infrared light, which means if a leaking pipe or vessel is viewed through a camera sensitized to infrared light and there is sufficient ambient infrared light for viewing, the leaking gas will appear on the camera’s image as a dark cloud. The gas plume appears on the camera’s display the way steam or smoke appears to the naked eye. Several paraffinic hydrocarbon compounds such as methane, ethane, propane, butane, pentane, and hexane are detectable with infrared cameras sensitized to light wavelengths of 3.3 to 5 micrometers (μm). Infrared cameras sensitized to longer wavelengths of light (10 μm to 11 μm) are useful for detecting leaks of gases such as sulfur hexafluoride, ammonia, chlorine dioxide, FREON-12, and ethylene to name a few.