
Non-dispersive analysis, while newer in discovery than dispersive analysis (Isaac Newton’s 17th-century prism), has actually seen far earlier application as continuous process analyzers. The basic design was developed during the years 1937-1938 by Dr. Luft and Dr. Lehrer in the laboratories of the German chemical company I.G. Farbenindustrie. By the end of World War II, over four hundred of these innovative instruments were in service in German chemical plants. Unlike most industrial analyzer technologies which are nothing more than adaptations of laboratory tests previously used by chemists to take manual measurements of substances, the invention of the first non-dispersive process gas analyzer embodied a wholly new analytical technique.
Industrial non-dispersive analyzers typically use either infrared or ultraviolet light sources, because most substances of interest absorb wavelengths in those regions rather than in the visible light spectrum. Non-dispersive spectroscopy using infrared light is usually abbreviated NDIR, while non-dispersive spectroscopy using ultraviolet light is abbreviated NDUV and non-dispersive spectroscopy using visible light is abbreviated NDVIS. Historically, NDIR is the more prevalent of the three technologies. Also, gas analysis is the more common application of non-dispersive spectroscopy in industry, as opposed to liquid analysis, which is why all the examples in this portion of the book assume the analysis of a process gas.
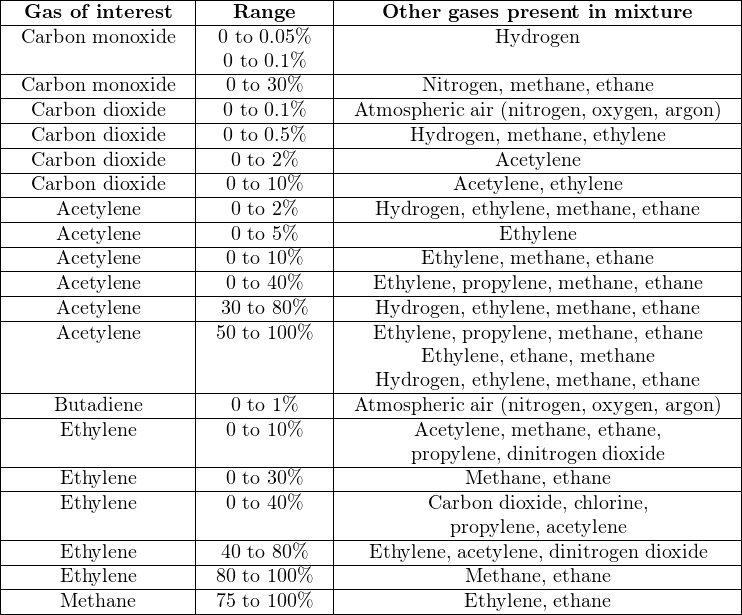
A partial listing of NDIR gas analysis applications at the I.G. Farben synthetic rubber facility in Hüls, Germany at the conclusion of World War II is shown here42 . Note the impressive diversity of ranges and gases of interest measured by NDIR analyzers at this time in history, less than ten years following the invention of the technique:
At a different I.G. Farben facility (in Uerdingen, Germany), an NDIR instrument was used as a safety gas detector for carbon monoxide (0 to 0.1% concentration) in open air. This was in a process area where high concentrations of carbon monoxide gas existed in the lines, and where a leak in a process line or valve posed a considerable safety hazard to personnel.
The challenge of any analytical measurement technology is how to achieve selectivity, where the analyzing instrument responds to the concentration of just one substance (one “species”) and to no other substance(s) in the mixture. If the substance of interest exhibits some unique physical property we can readily measure with sensors, the selectivity problem is easy to solve: just measure that one property exclusively, and no other substance will interfere.
In the case of absorption spectrometers such as non-dispersive analyzers, the challenge is to selectively measure the concentration of certain light-absorbing substances amidst the presence of other substances also absorbing certain wavelengths of light. If the substance of interest is the only substance present in the mixture capable of absorbing light, selectivity is guaranteed. However, most applications in industry are not this easy, with the mixture containing other light-absorbing substances besides the one of interest. Some of these substances may absorb completely different wavelengths of light, while others may have absorption bands overlapping the absorption bands of the substance of interest (i.e. the interfering substances absorb some of the same wavelengths of light absorbed by the substance of interest, in addition to absorbing some unique wavelengths of their own).
Dispersive spectrographs achieve selectivity by “disassembling” the spectrum into individual wavelengths and measuring them one by one, but a non-dispersive analyzer must somehow distinguish different spectral responses without this “disassembly” of wavelengths. The bulk of this section is devoted to a discussion of exactly how selectivity is accomplished using the NDIR technique.
23.6.1 Single-beam analyzer
Non-dispersive analyzers employ the principle of spectrographic absorption to measure how much of a particular substance exists within a sample. NDIR gas analyzers shine light through a windowed sample chamber (typically called a cell), through which a fresh flow of process gas continually moves. Certain “species” (compounds) of gas within the sample stream absorb part of the incident light, and therefore the light exiting the cell becomes partially depleted of those wavelengths. A heat-sensitive detector placed behind the cell measures how much infrared light did not get absorbed by the sample gas. If we imagine the concentration of light-absorbing gas increasing over time, more of the infrared light entering the cell will being absorbed by the gas and converted into heat within the cell, leaving less light exiting the cell to generate heat at the detector. The simplest style of non-dispersive analyzer uses a single light source, shining continuously through a single gas cell, and eventually falling on a small thermopile (converting the received infrared light into heat, and then into a voltage signal):
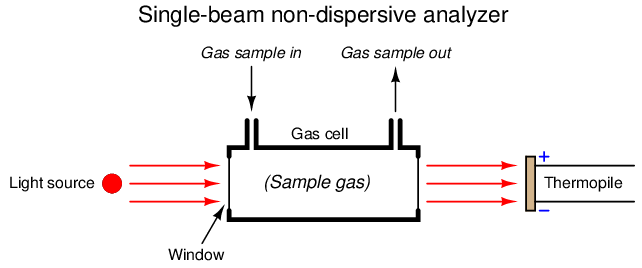
This crude analyzer suffers from multiple problems. First, it is non-selective: any light-absorbing gas entering the sample cell reduces heat at the detector (i.e. generates less thermopile voltage), regardless of the species. It might work well enough in an application where the only light-absorbing gas in the process mixture happens to be the one gas we are interested in measuring, but most industrial analyzer applications are not like this. In most cases, our process sample contains multiple species of gases capable of absorbing light within a similar range of wavelengths, but we are only interested in measuring one of them. An example would be the measurement of carbon dioxide (CO2) concentration in the exhaust gas of a combustion furnace: most of the gases exiting the furnace do not absorb infrared light (nitrogen, oxygen), but CO2 gas does. However, carbon monoxide (CO), water vapor (H2O), and sulfur dioxide (SO2) also absorb infrared light, and are all normally present in the exhaust gas of a furnace to varying degrees. Since our crude NDIR analyzer is non-selective, it cannot differentiate between carbon dioxide and any of the other infrared-absorbing gases present in the exhaust gas.
Another significant problem with this analyzer design is that any variations in the light source’s output cause both a zero shift and a span shift in the instrument’s calibration. Since light sources tend to weaken with age, this flaw necessitates frequent re-calibration of the analyzer.
Finally, since the detector is a thermopile, its output will be affected not just by the light falling on it, but also by ambient temperature, causing the analyzer’s output to vary in ways completely unrelated to sample gas composition.
23.6.2 Dual-beam analyzer
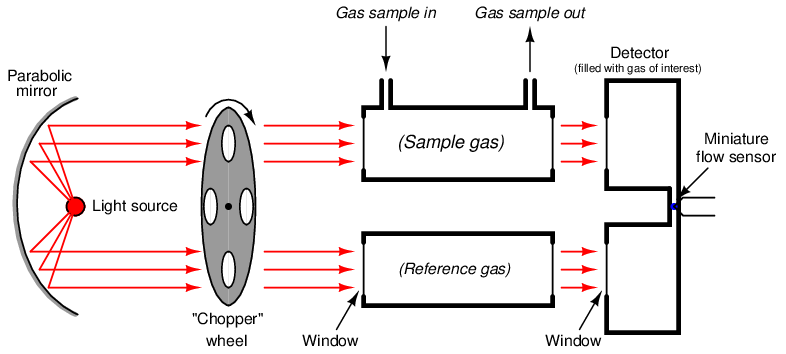
One way to improve on the single-beam analyzer design is to split the light beam into two equal halves, then pass each half-beam through its own cell. Only one of these cells will hold the process gas to be analyzed – the other cell is sealed, containing a “reference” gas such as nitrogen that absorbs no infrared light. At the end of each cell we will place a matched pair of thermopile detectors, connecting these detectors in series-opposing fashion so equal voltages will cancel:
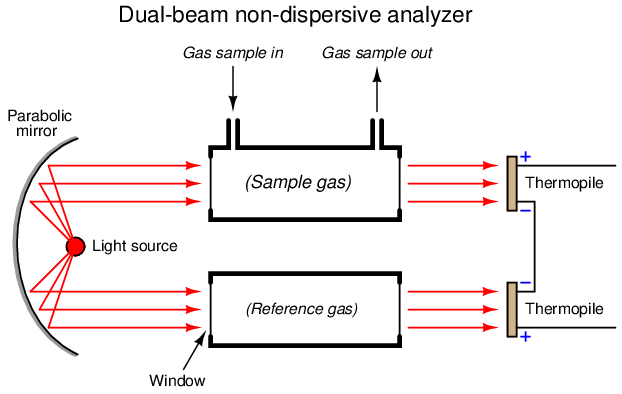
Let us perform some “thought experiments” on this apparatus to explore its behavior. Imagine the sample gas being a non-absorber of infrared light just like the reference gas. In this virtual experiment, the opposed detector pair will generate no voltage signal because each of the two detectors receives the same (full) amount of incident light.
Next, we will alter one of the variables in our “thought experiment” to see what difference that variable makes. Here, we imagine the sample containing some concentration of an infrared-absorbing gas while the reference gas continues to absorb no light. Now, the two thermopile detectors will receive differing intensities of infrared light, causing the series-opposed pair to be out of balance, generating a net voltage signal we can measure as an indication of light-absorbing gas concentration.
The addition of a reference gas chamber and second thermopile detector completely eliminates the ambient temperature problem seen in the single-detector apparatus. If the analyzer’s temperature happens to rise or fall, the voltages output by both thermopiles will rise and fall equally, canceling each other out so that the only voltage produced by the series-opposing pair will be that produced by differences in received light intensity.
The dual-detector design also eliminates the problem of “zero drift” as the light source ages. As time progresses and the light source becomes dimmer, both detectors see less light than before. Since the detector pair measures the difference between the two light beam intensities, any degradation common to both beams will be ignored43 .
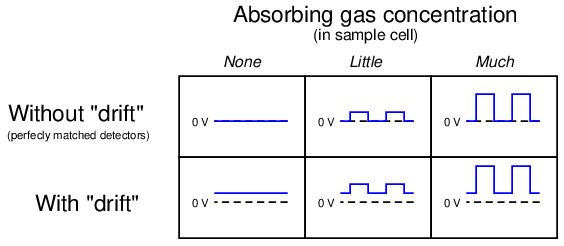
Another detector problem still remains, in that an imbalance will develop if one detector happens to “drift” in voltage apart from the other, so they are no longer in perfect counter-balance even with the same received light intensities. This might happen if one of the thermopiles experiences greater ambient temperature than the other, perhaps due to convective heat transfer from hot process sample gas in the nearby sample cell and not the reference cell. An ingenious solution to this problem is to insert a spinning metal “chopper” wheel in the path of both light beams, causing the light beams to pulse through the sample and reference cells at a low frequency (typically a few pulses per second):
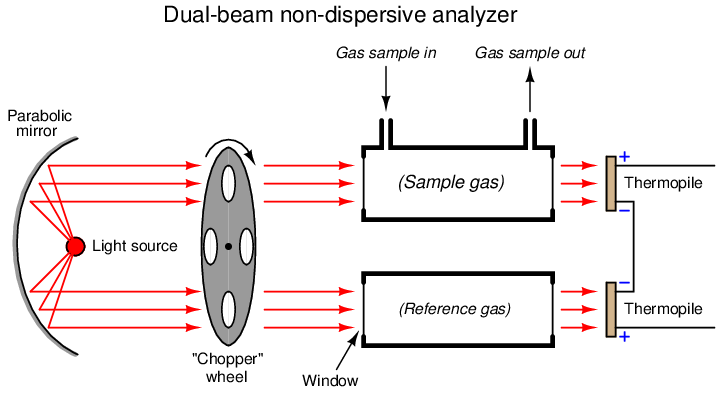
The effect of the “chopper” is to make the detector assembly output a pulsating (“AC”) voltage signal rather than a steady voltage signal. The peak-to-peak amplitude of this pulsating signal represents the difference in light intensity between the two detectors, but any “drift” will manifest itself as a constant or very slowly-changing (“DC”) bias voltage. The following table illustrates the detector assembly signal for three different gas concentrations (none, little, and much) both with and without a mis-match in detector signals due to thermal drift:
This DC bias voltage is very easy to filter in the amplifier section of the analyzer. All we need is capacitive coupling between the detector assembly and the amplifier, and the amplifier will never “see” the DC bias voltage:
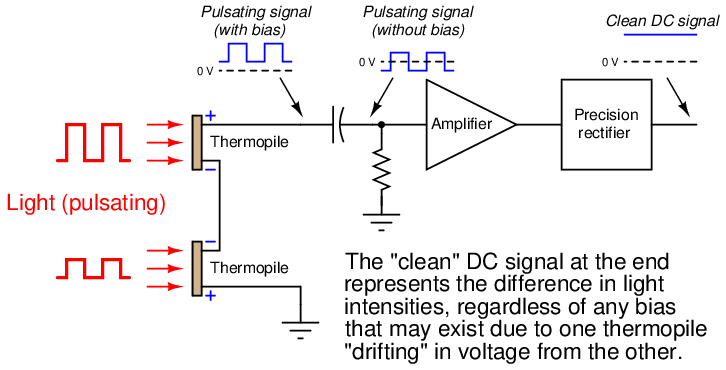
With the detector assembly producing an “AC” (pulsing) signal instead of a “DC” signal, and by using capacitive coupling to the amplifier, the electronic circuit responds only to changes in the amplitude of the AC waveform and not to its DC bias. This means the analyzer will only respond to changes in detector temperature resulting from changes in light absorbance (i.e. gas concentration), and not from any other factor such as ambient temperature drift. In other words, since the amplifier has been built to only amplify pulsing signals, and the only thing pulsing in this instrument is the light, the electronics will only measure the effects generated by the light, rejecting all other stimuli.
Despite the design improvement of the chopper wheel and AC-coupled amplifier circuit, another significant problem remains with this analyzer: it is still a non-selective instrument. Any light-absorbing gas entering the sample cell will cause the detector pair to generate a signal regardless of the type of gas, because the thermopile detectors respond to a broad44 range of light wavelengths. While this may suffice for some industrial applications, it will not for most where a mixture of light-absorbing gases coexist. What we need is a way to make this instrument selective to just one type of gas, in order that it be a useful analyzer in a wider variety of process applications.
23.6.3 Luft detectors
A very clever way to achieve selectivity with a non-dispersive optical analyzer is to replace the thermopiles with a detector more sensitive to the wavelengths absorbed by the gas of interest than to the wavelengths absorbed by any other (“interfering”) gas species. Dr. Luft invented just such a detector when developing the NDIR gas analyzer for I.G. Farben in the late 1930’s. His design used two gas chambers and a thin diaphragm to measure the difference in light intensity exiting the sample and reference cells:
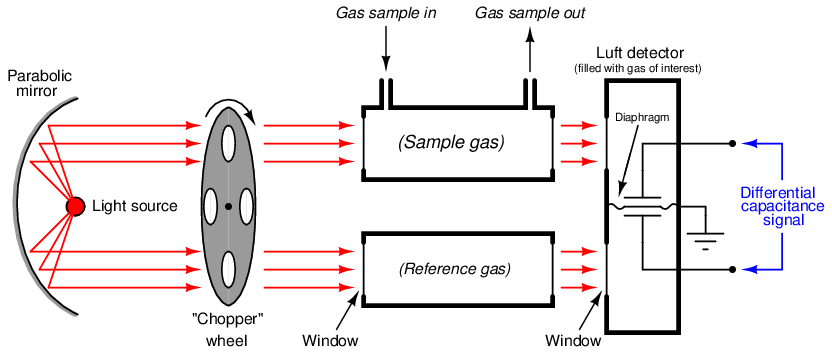
As light enters the dual chambers of the detector, the light absorbed by the fill gas causes those gas molecules to increase temperature45 . This expands the gas, pressing against the diaphragm. If the light intensities are equal, the pressures will be equal and no diaphragm motion will result. If the light intensities are unequal (due to the sample cell absorbing some of the wavelengths), the gas pressure developed inside that half of the Luft detector will be less, causing the thin diaphragm to bow in that direction. A set of fixed metal plates senses the diaphragm’s position using the differential capacitance technique (just like many modern differential pressure sensors). With the “chopper” wheel working to pulsate light through the sample and reference gas cells, the diaphragm motion will likewise pulsate, and the resulting “AC” pulse signal may be filtered and amplified to represent absorbing gas concentration.
What makes the Luft detector selective is that it is filled with a 100% concentration of the gas we are interested in measuring. This means only those wavelengths of light absorbed by the gas of interest will develop heat (and pressure) inside the detector chambers. Different wavelengths of light absorbed by other (“interfering”) gases in the sample will not be absorbed to the same degree (or at all) by the gas inside the Luft detector, and therefore the pressure pulses inside the Luft detector will be primarily a function of our interest-gas concentration and not of the interfering-gas concentration(s).
The selectivity gained by a gas-filled Luft detector is not obvious to see at first, and deserves some explanation. We may explore this selective behavior in more detail by performing a set of “thought experiments” whereby we imagine the effects of different gas species on an NDIR analyzer equipped with a Luft detector.
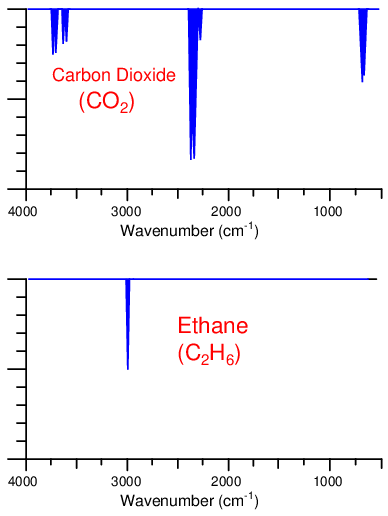
Suppose we have an application where we intend to measure carbon dioxide concentration in a gas mixture also containing ethane. In a simple dual-beam NDIR detector using thermopile detectors, both carbon dioxide and ethane present in the sample chamber will generate a detector response, since both gas species absorb infrared light, and the thermopile detectors respond to any change in the amount of infrared light received at the detector. Thus, such a simple analyzer could not tell the difference between a change in carbon dioxide concentration versus a change in ethane concentration. This makes ethane an “interferent” given our goal of only measuring carbon dioxide concentration.
While both carbon dioxide and ethane gases absorb infrared light, they do so at different specific wavelengths. The following spectral plots show the unique infrared absorption bands for carbon dioxide and ethane, respectively. As you can see, the wavelengths of infrared light absorbed by each species of gas are unique, and do not overlap:
Let us now imagine replacing the thermopile detectors with a Luft detector, its dual chambers filled with a 100% concentration of carbon dioxide gas. If neither carbon dioxide nor ethane are present in the sample chamber, light will pass from the source undiminished to the Luft detector, causing equal heating of the CO2 gas in both chambers and therefore zero response. This is precisely what we would expect from any dual-beam NDIR instrument, Luft detector or not.
For our next “thought experiment,” imagine carbon dioxide gas entering the sample chamber. Those carbon dioxide molecules entering the sample chamber will absorb some of the infrared light emitted by the source. Since the carbon dioxide gas molecules inside the Luft detector can only be heated by those same wavelengths of light absorbed by the molecules in the sample chamber, the sample-side of the Luft detector will now experience less heating than before (while the reference-side experiences the same degree of heating), causing a difference in pressure inside the Luft detector and therefore generating a response. Once again, this is precisely what we would expect from any dual-beam NDIR instrument, Luft detector or not.
However, if we now imagine only ethane molecules entering the sample chamber, the Luft detector’s response will be different from that of the thermopile detector. Surely, the ethane molecules will absorb some of the infrared light entering that chamber, but these “missing” wavelengths will be of no effect at the Luft detector because they aren’t absorbed by the carbon dioxide gas inside the Luft detector chambers anyway, and therefore would not affect the temperature of the detector’s carbon dioxide gas whether missing or present. In other words, the gas-filled Luft detector “doesn’t care” about any wavelengths of light absorbed by gases in the sample chamber so long as the absorption pattern of the sample gas does not coincide at any point with the absorption pattern of the gas filling the Luft detector. This means the ethane’s attenuation of infrared light wavelengths will be ignored by the carbon-dioxide-filled Luft detector, while carbon dioxide’s attenuation of infrared light will be sensed by the Luft detector. We may now say that the instrument is “sensitized” to carbon dioxide gas, and that the Luft detector is “selective” to one species of gas over and above all other species.
If a mixture of carbon dioxide and ethane gases enters the sample chamber, each type of gas molecule will absorb its unique pattern of light wavelengths, but only the attenuation of those wavelengths matching the absorption pattern of the Luft detector’s fill gas will register in the detector. Thus, the Luft detector is able to selectively measure the concentration of one gas inside the sample chamber to the exclusion of all other gases having different optical absorption patterns.
A modern variation on the Luft detector design replaces Luft’s original microphone-style thin diaphragm with a narrow channel and a highly sensitive thermal flow sensor46 connecting the two gas-filled chambers. Any difference in expansion between the gases of the two chambers when heated by light causes gas to move past the flow sensor, thus generating a signal:
As the chopper wheel pulses incident light to either chamber of the detector, gas will flow back and forth through the narrow passageway connecting the two chambers, causing an alternating flow response from the flow sensor.
The advantage of a diaphragm-less detector is that it is just as insensitive to mechanical vibration as a thermopile (having no moving parts), but retains the spectral selectivity of the traditional Luft-style detector (being filled with the gas of interest).
While Luft-style detectors greatly enhance the selectivity of non-dispersive spectrographic gas analyzers, there is still room for improvement. Perfect selectivity of measurement is assured by a Luft detector only when the light absorption spectra of the interference gas(es) do not overlap at all with the absorption spectrum of the gas of interest. If there is some overlap, interference will result.
To address this concern, we will explore one more design feature of modern non-dispersive analyzers: filter cells.
23.6.4 Filter cells
If other species of gas present in the sample do not absorb any of the light wavelengths absorbed by the one gas we’re interested in measuring, the selectivity of a Luft detector will be total: the gas-filled detector will only respond to the presence of the gas we are interested in. Usually, though, process applications are not this simple. In most applications, the interfering gases have absorption spectra overlapping portions of the interest-gas spectrum. This means changes in interference gas concentration will be sensed by the detector (though not as strongly as changes in the concentration of the gas of interest) because part of the light spectrum absorbed by the interfering gas(es) will have a heating effect on the pure gas inside the detector.
An example of overlapping absorption spectra is found with the combination of carbon dioxide and acetylene gases:
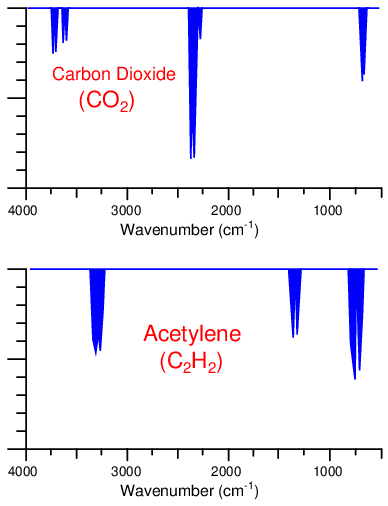
As you can see, there is some common absorption between these two gas species toward the right-hand side of the scale, around 700 cm−1 (approximately 14000 nm wavelength). An NDIR analyzer equipped with a Luft detector filled with 100% of carbon dioxide gas will respond strongly to concentrations of carbon dioxide gas in the sample chamber, and weakly to concentrations of acetylene gas in the sample chamber. Since acetylene does absorb some of the infrared light wavelengths absorbed by carbon dioxide, acetylene gas has the potential to affect the Luft detector and make the analyzer “think” it is measuring slightly more carbon dioxide gas than it actually is.
One more addition to our NDIR instrument helps eliminate this problem: we add two more gas cells in the path of the light beams, each one filled with 100% concentrations of the interfering gas. For this particular example, we would fill each filter cell with a 100% concentration of acetylene gas, and the Luft detector cell with a 100% concentration of carbon dioxide gas:
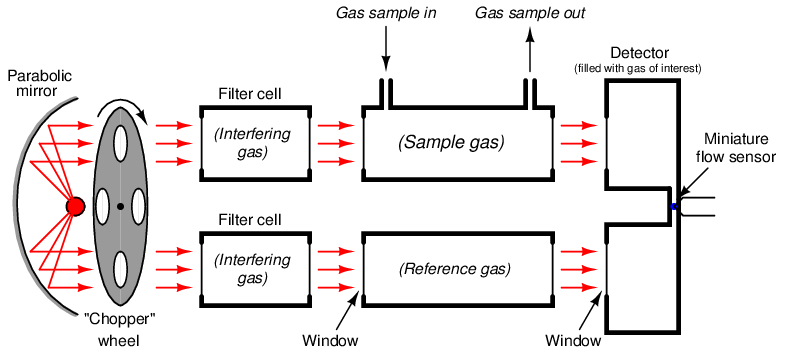
These filter cells purge the light of those wavelengths normally absorbed by the interfering gas (acetylene) inside the sample cell. As a result, the presence of that interfering gas in the sample cell will have negligible effect on the light exiting the sample cell, because those wavelengths have already been severely attenuated by the filter cells. If the filter cells happened to be 100% effective in filtering all wavelengths specific to the interfering gas, there would be absolutely none of the interfering gas’s specific wavelengths of light left to be absorbed inside the sample cell, and therefore the interfering gas would have absolutely no effect on the detector’s response. In other words, by filtering out all the light wavelengths absorbed by the interfering gas inside the filter cells, the presence of that same gas in the sample cell will have no effect on the detector, and therefore it can no longer interfere with the measurement of our gas of interest.
So long as our gas of interest exhibits absorption wavelengths not shared by the interfering gas (i.e. wavelengths of light unique to the gas of interest alone), these wavelengths will still be able to pass through the filter cells and into the sample cell where they will change intensity as the gas of interest varies in concentration. Thus, the detector now only responds to the gas of interest (carbon dioxide), and not to the interfering gas (acetylene).
As effective as this filtering technique is, it has the limitation of only working for one interfering gas at a time. If multiple interfering gases exist in the sample stream, we must use multiple filter cells to block those light wavelengths47 .
A photograph showing a dual-beam NDIR analyzer appears here:
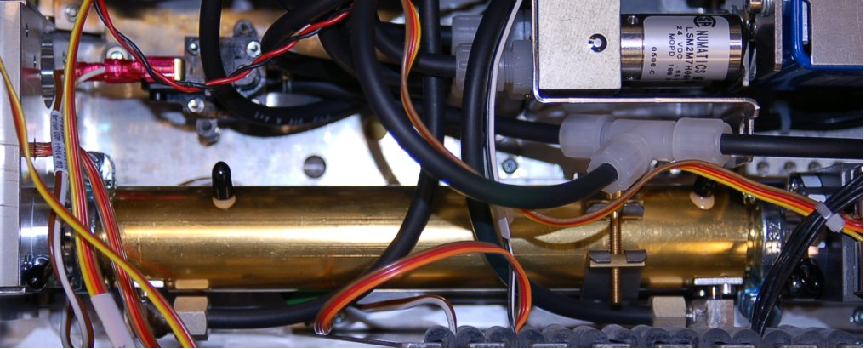
What looks like a single gold-colored gas cell is actually two cells (a divider separating the tube lengthwise into two chambers), one for the sample gas and the other for reference. Black-colored hoses pass sample gas through the bottom half of the tube, while the top half is filled with nitrogen gas (the tube connections capped and sealed with black-colored plastic). The light source and chopper assembly appears on the left-hand side of the tube, while the detector resides on the right-hand side.
In this particular instrument (a Rosemount Analytical model X-STREAM X2), the chopper wheel is driven by a stepper motor:
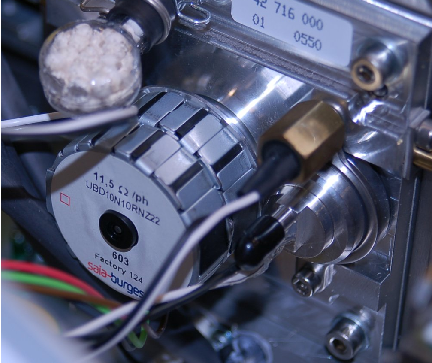
The head of the infrared light source appears just to the right of the chopper wheel motor.
The detector used in the X-STREAM NDIR analyzer is a modern variant of the Luft detector, with a micro-flow sensing element detecting pulses of gas flow between two chambers. In this particular analyzer the detector chambers are filled with carbon monoxide (CO) gas, to sensitize it to that species:
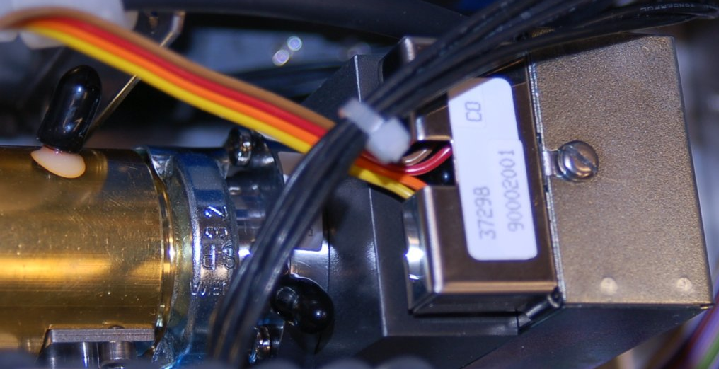
This instrument’s maximum detection range happens to be 0 to 1000 ppm of carbon monoxide, with the ability to turn down to a range of 0 to 400 ppm.